

BullionStar Financials FY 2023 – Year in Review

 BullionStar
 0 Comments
This post reviews BullionStar’s financial performance and milestones for the financial year ending 30 June 2023 (FY 2023).
At BullionStar, transparency in sharing our financial performance is a key part of our tradition. We provide detailed insights into our sales data, highlighting demand for different precious metals products and categories, along with other significant developments. For those interested in exploring our financial journey further, links to reviews of previous years are readily available below:
BullionStar Financials FY 2022 – Year in Review
BullionStar Financials FY 2021 – Year in Review
BullionStar Financials FY 2020 – Year in Review
BullionStar Financials FY 2019 – Year in Review
BullionStar Financials FY 2018 – Year in Review
BullionStar Financials FY 2017 – Year in Review
BullionStar Financials FY 2016 – Year in Review
BullionStar Financials FY 2015 – Year in Review
FY 2023, from 1 July 2022 to 30 June 2023, marked yet another robust year for BullionStar, as we saw sales revenues reaching SGD 396.4 million. The sales revenue for FY2023 was marginally higher (1.2%) compared to FY 2022.
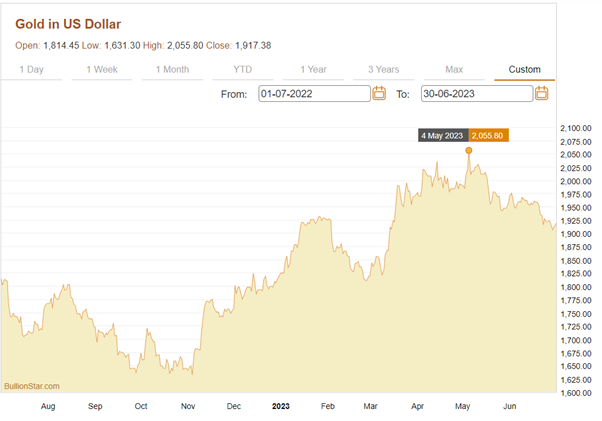
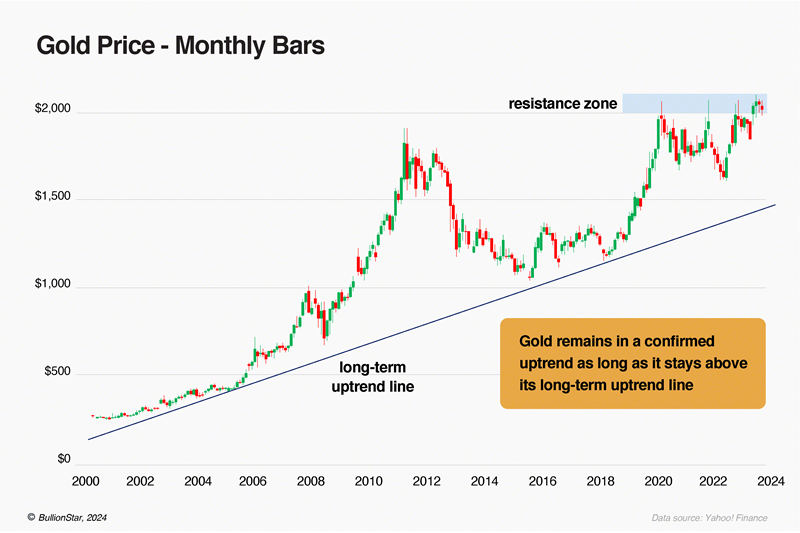
The spot gold price in US dollars ended fiscal year 2023 within 5.76% of where it had opened (open of $1814.45 on 1 July 2022 and close of $1919 on 30 June 2023). Spot gold hit a low of $1615 in H2 2022 before the price returned to an all-time-high of $2067 on 4 May 2023 on the heels of the liquidation of Silvergate Bank, the collapse of Silicon Valley Bank, Signature Bank and First Republic Bank on top of strong Central Bank gold purchases in Q1 2023.
The spot price of silver in US dollars gained 11% over fiscal year 2022, opening at $20.47 on 1 July 2022 to close at $22.73 on 30 June 2023. Silver traded in a channel between $17.56 and $21.23 for most of H2 2022 before breaking out in mid-November 2022 and rising to a high of $24.63 in January 2023. With volatility returning to the silver market in H1 2023, we saw spot silver then fall sharply to $19.92 in March 2023 before taking an aggressive U-turn and rising to the fiscal year high of $26.1 in mid-April and early May 2023 in reaction to the same catalysts listed above for gold.
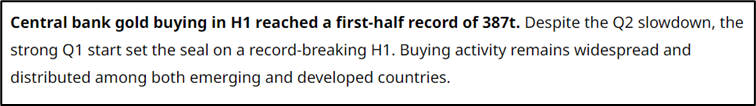
Central Banks Accumulated Physical Gold at Record Levels
FY 2023 saw us publish many articles about Central Bank gold purchases here, here, here and here.
At the risk of sounding like a broken record, it is important to ask the question, “Why are Central Banks buying physical gold at this time, even when the price of Gold denominated in US Dollar terms is close to its All-Time High and higher than any other period in history?”
For H1 2023, The World Gold Council reported:
The main objective of a Central Bank is to ensure financial stability for its country, and as the geopolitical landscape across the world is increasing fragmented, fractured and polarized, the previous methods of portfolio allocation and managing reserves in a world that was keen on globalization and connectedness is now no longer effective nor valid.
Central Banks are increasingly motivated to diversify their reserve assets into physical gold due to the several attractive traits it possesses. Gold is easy to buy and sell (liquid), has a long history of being money and as a proven store of value across thousands of years. It eliminates the risk that a country that issues a currency goes bankrupt (no default or counterparty risk), is of the same quality and likeness across the world (homogeneous), and it’s worth is recognized across the world (ubiquitous).
While other assets held by Central Banks may share certain individual traits listed above, the collective combination of such traits are unique to physical Gold.
With the “weaponization” of the US dollar and the SWIFT system, most recently used to impose sanctions on Russia, Central Banks that are overly concentrated in holding US dollar denominated reserves or assets or perceive international sanctions to be a likely threat to their country, are logically moving their assets or reserves out of US dollar assets and the SWIFT system. Gold is natural recipient of those outflows.
Are the risks faced by Centrals Banks in this changing world much different from those faced by us at an individual level?
Inflation was a Global Phenomenon
FY 2023 was also marked by significant inflationary pressures globally, both in developed economies and emerging economies. Inflation in the United States hit a 40-year high at the start of FY 2023 with a 9.1% print, while the Eurozone hit a record high of 10.6% in October 2022 and similarly the United Kingdom faced peak inflation at 11.1% in October 2022. Venezuela, facing hyperinflation for years, continued to struggle with extreme inflation (exceeding 400%) during this period. Lebanon, experiencing severe economic crisis, saw inflation exceeding 250%. Argentina grappled with similar challenges with inflation exceeding 100%. Several other countries, including Turkey, Sri Lanka, Iran and Zimbabwe also experienced significant inflation pressures during this period.
In a reaction to the above, we saw the US Central Bank, the Federal Reserve, spend much of FY 2023 trying to quash the inflation pressures in the US economy by hiking interest rates aggressively. In FY 2023, we saw the United States Fed Funds Rates go from 1.75% in July 2022 to 5.25% by end June 2023!
United States Fed Funds Rates
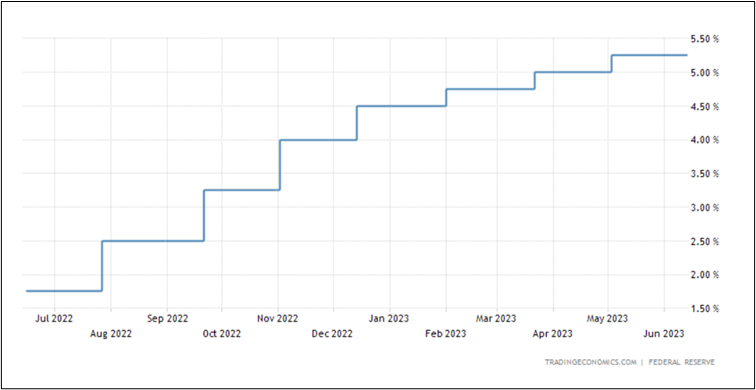
During the same period, we saw the US dollar price of spot gold act as a hedge and saw an 5.76% increase in price as shown in the chart below. Physical gold is often considered a way to protect against inflation for given its limited supply and its quality as a tangible asset with no counterparty risk, where unlike fiat currencies, which central banks can print more of, the supply of physical gold is relatively fixed and finite. This scarcity helps maintain its value over time, as increasing demand doesn’t get met with an ever-growing supply, and unlike digital assets or shares, physical gold is a physical asset that you can hold and store, which is appealing during times of uncertainty and financial instability.
Growth in Our People and Vaulting Infrastructure
Over FY 2023, we’ve invested in our people and infrastructure by expanding our team and vaulting infrastructure. This investment positions us for continued growth and success in the future.

With Singapore’s unique position of being a small, independent, politically stable nation, and having a balanced diplomacy by engaging with all major powers while maintaining its own interests and upholding its commitment to international law, we are fortunate to have seen significant growth in international customers trusting us as custodians to vault their bullion with us during these turbulent times as geopolitical tensions worsen.
Our vault was also featured in Channel NewsAsia’s (CNA) documentary film on Singapore’s national reserve assets. The CNA documentary, which is titled “Singapore Reserves: The Untold Story | Singapore Reserves Revealed”, can be viewed on the CNA Insider channel on YouTube here.
The segment featuring BullionStar’s CEO in BullionStar precious metals vault, and which also features footage from the MAS gold vault, runs from approximately minutes 11:46 until 15:35. That segment can be seen here.
FTX Collapse and the Aftermath
As one of the earliest bullion dealers in world to accept Bitcoin back in May 2014 and that continues to enable customers to buy, sell or trade bullion with cryptocurrency, we received an influx of customers that swapped their cryptocurrencies for precious metals to be stored at BullionStar or swapped their stored precious metals for cryptocurrencies during FY 2023.
In a flight to safety and security, we were fortunate to win over new customers who placed their trust in our state-of-the-art vault storage solution that offers full direct legal ownership of their stored bullion and full insurance coverage along with 5 different audit methods to verify the existence and correctness of the stored bullion for absolute transparency and peace of mind.
BullionStar Financials FY 2023 – Year in Review – Sales
BullionStar’s sales revenues remained robust in FY 2023, totalling SGD 396.4 M.
Sales per Product Category
In FY2023, gold represented 73.56% of sales, and silver represented 25.28% of sales, with the remaining 1.16% comprising mostly platinum sales. This breakdown in representation is very similar to the breakdown in FY2022.
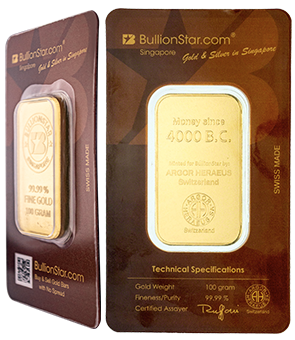
Within the overall gold product category, 79.22% of sales in FY2023 represented gold bars, 20.4% represented gold coins, with the remainder attributed to numismatics, gold jewellery, and other products which together comprised 0.38%. This means that 58.28% of all FY 2023 sales were in gold bars, 15% in gold coins, and 0.28% in other gold product segments.
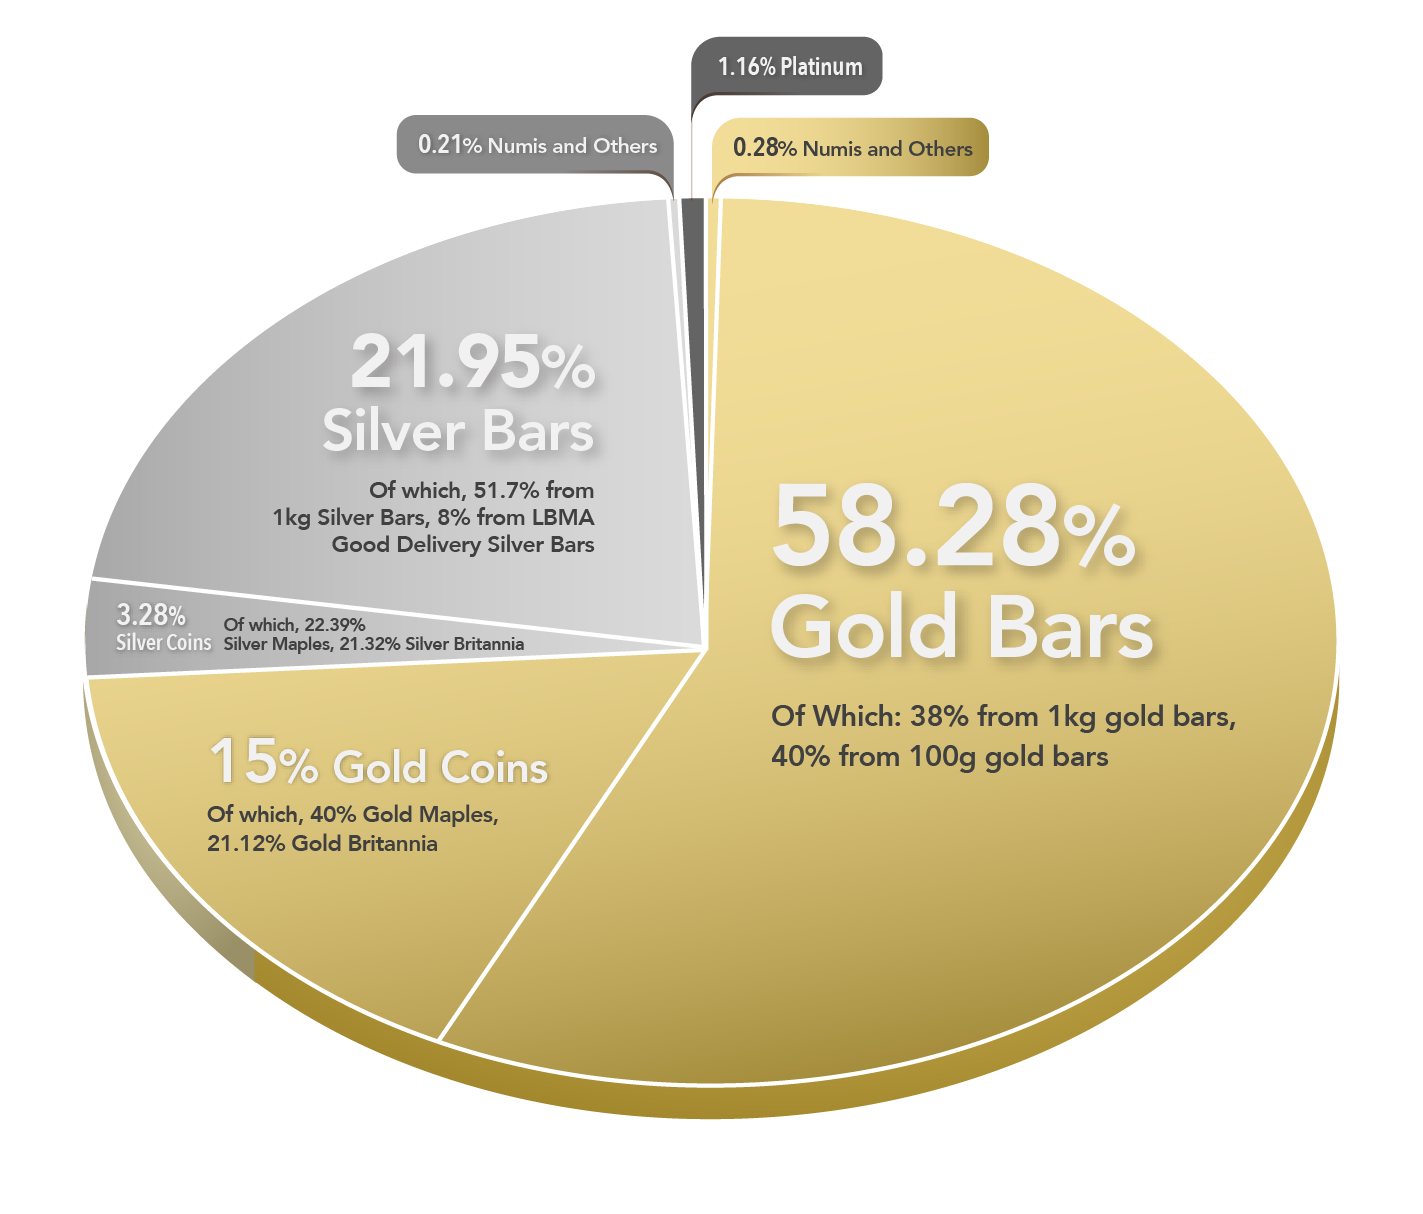
Within the gold bar category, more than 78% of sales comprised the larger investment gold bars, with 38% representing 1kg gold bars, and 40% representing 100g gold bars. Within the gold coin category, the leading seller was Canadian Gold Maples (40% of gold coin sales), followed by United Kingdom Gold Britannia (21.12% of gold coin sales.)
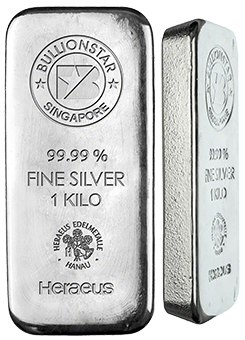
Within the silver product category, 86.82% of revenue from silver during FY2023 represented silver bars, 12.97% represented silver coins and rounds, and the remaining 0.21%, was attributed to numismatics and other products. This means that 21.95% of all FY 2023 sales were in silver bars and 3.28% in silver coins.
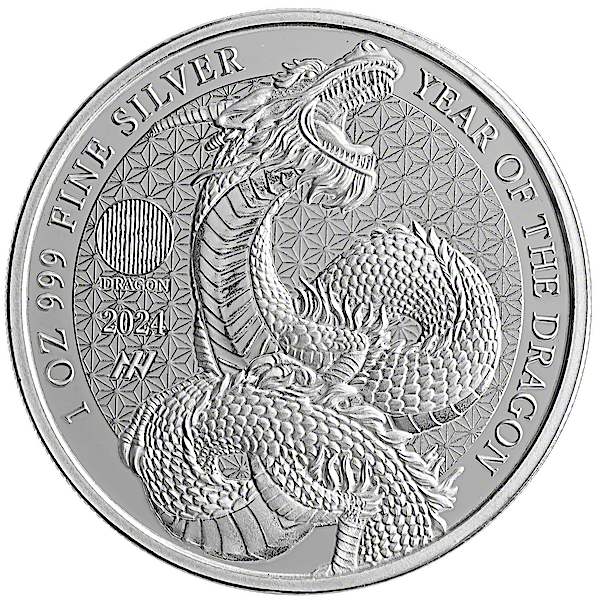
Within the silver bar category, 51.7% of silver bars sold were 1kg silver bars, while an additional 8% were LBMA Good Delivery silver bars. Within the silver coin category, the Royal Canadian Mint’s Canadian Silver Maples were the leading seller, representing 22.39% of silver coins sales. Coming in at a very close second, The Royal Mint’s Silver Britannia represented 21.32% of silver coins sales.
BullionStar recorded 33,033 customer buy orders in FY 2023, compared to 29,496 buy orders in FY 2022, representing 11.99% increase in the number of customer buy orders.
With FY 2023 sales revenues being 1.2% higher than FY 2022 compared to a 11.99% increase in the number of buy orders, it is not surprising that the average order size in FY 2023, SGD 11,932.53, is lower than the corresponding figure from FY 2022 of SGD 13,219.87. Similarly, the median order size in FY2023 was SGD 1,244.87, also lower than the corresponding figure in FY2022 of SGD 1,357.74.
As one of the world’s most global bullion dealers with a strong international profile, there were customers from a staggering 116 countries represented in BullionStar’s FY2023 sales. Since BullionStar was launched in 2012, there have been BullionStar customers from 126 countries across the world.
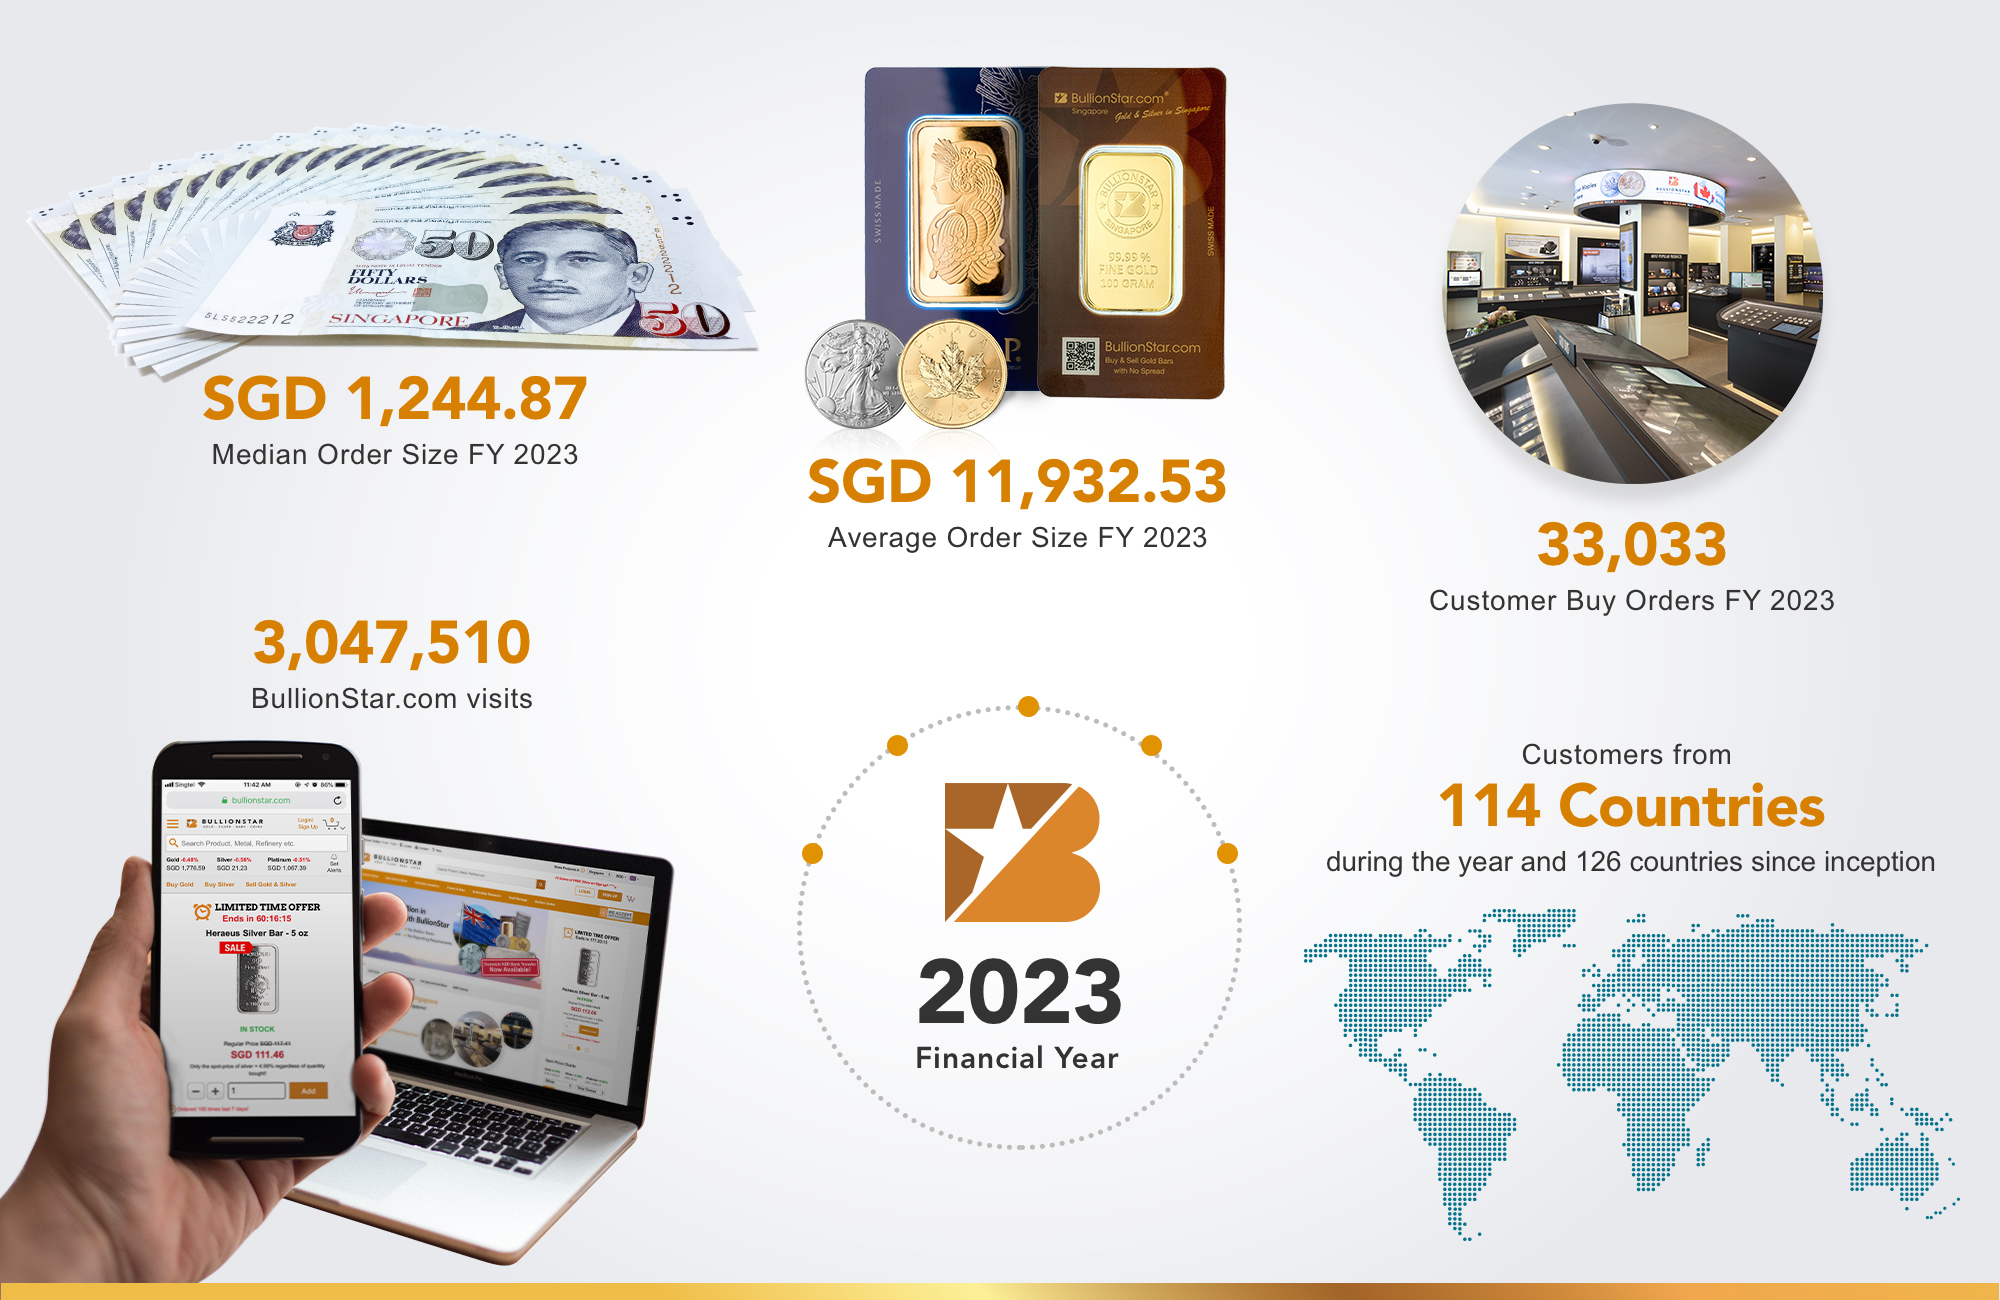
During FY2023, there were 3,047,510 visits to the BullionStar.com website, which was a 29.3% increase on the number of website visits in FY2022.
Popular Blog Posts by BullionStar
 How Much Gold is in the FIFA World Cup Trophy?
 Essentials of China's Gold Market
 Singapore Rated the World’s Safest & Most Secure Nation
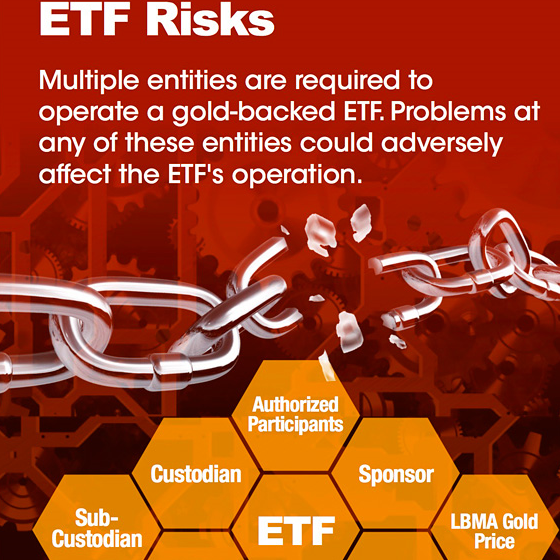 Infographic: Gold Exchange-Traded Fund (ETF) Mechanics
 BullionStar Financials FY 2020 – Year in Review
 Why a Powerful Silver Bull Market May Be Ahead
 What’s Driving Gold to All-Time Highs?
 What You Need to Know About Gold's Long-Term Bull Market
 BullionStar Financials FY 2023 – Year in Review
 Year of the Dragon: Surge in Singapore's Gold & Silver Sales